|
Download Data (XLS File) |
|
|||||
|
|||||
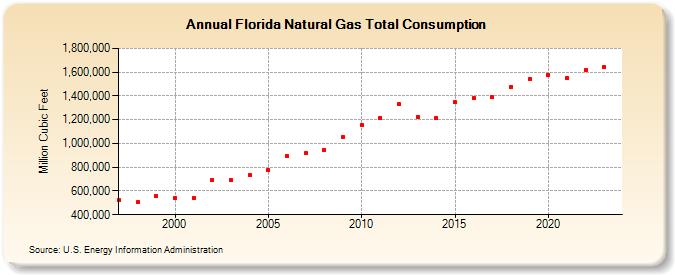
| Florida Natural Gas Total Consumption (Million Cubic Feet) | |||||
| Decade | Year-0 | Year-1 | Year-2 | Year-3 | Year-4 | Year-5 | Year-6 | Year-7 | Year-8 | Year-9 |
|---|---|---|---|---|---|---|---|---|---|---|
| 1990's | 522,116 | 503,844 | 559,366 | |||||||
| 2000's | 541,847 | 543,143 | 689,337 | 689,986 | 734,178 | 778,209 | 891,611 | 917,244 | 942,699 | 1,055,340 |
| 2010's | 1,158,452 | 1,217,689 | 1,328,463 | 1,225,676 | 1,214,531 | 1,345,790 | 1,382,558 | 1,387,960 | 1,477,160 | 1,542,785 |
| 2020's | 1,578,391 | 1,551,524 | 1,619,069 | 1,634,716 | 1,694,240 |
| - = No Data Reported; -- = Not Applicable; NA = Not Available; W = Withheld to avoid disclosure of individual company data. |
| Release Date: 6/30/2026 |
| Next Release Date: 7/31/2026 |