|
Download Data (XLS File) |
|
|||||
|
|||||
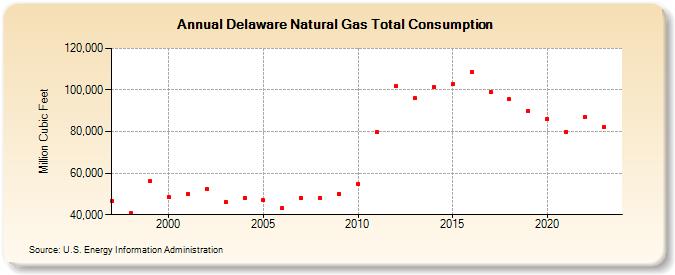
| Delaware Natural Gas Total Consumption (Million Cubic Feet) | |||||
| Decade | Year-0 | Year-1 | Year-2 | Year-3 | Year-4 | Year-5 | Year-6 | Year-7 | Year-8 | Year-9 |
|---|---|---|---|---|---|---|---|---|---|---|
| 1990's | 46,511 | 40,809 | 56,013 | |||||||
| 2000's | 48,387 | 50,113 | 52,216 | 46,177 | 48,057 | 46,904 | 43,190 | 48,155 | 48,162 | 50,148 |
| 2010's | 54,825 | 79,715 | 101,676 | 95,978 | 101,379 | 102,693 | 108,562 | 98,966 | 95,516 | 89,767 |
| 2020's | 85,942 | 79,680 | 86,809 | 81,691 | 78,670 |
| - = No Data Reported; -- = Not Applicable; NA = Not Available; W = Withheld to avoid disclosure of individual company data. |
| Release Date: 6/30/2026 |
| Next Release Date: 7/31/2026 |