|
Download Data (XLS File) |
|
|||||
|
|||||
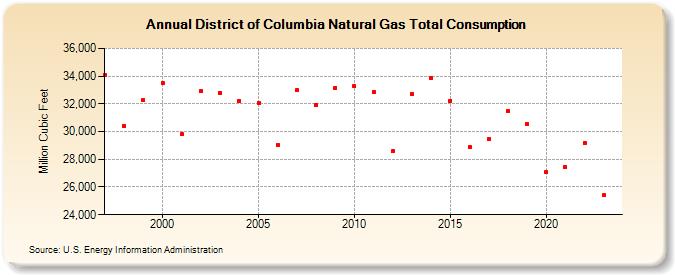
| District of Columbia Natural Gas Total Consumption (Million Cubic Feet) | |||||
| Decade | Year-0 | Year-1 | Year-2 | Year-3 | Year-4 | Year-5 | Year-6 | Year-7 | Year-8 | Year-9 |
|---|---|---|---|---|---|---|---|---|---|---|
| 1990's | 34,105 | 30,409 | 32,281 | |||||||
| 2000's | 33,468 | 29,802 | 32,898 | 32,814 | 32,227 | 32,085 | 29,049 | 32,966 | 31,880 | 33,177 |
| 2010's | 33,251 | 32,862 | 28,561 | 32,743 | 33,848 | 32,237 | 28,888 | 29,457 | 31,490 | 30,534 |
| 2020's | 27,090 | 27,458 | 29,182 | 25,398 | 26,268 |
| - = No Data Reported; -- = Not Applicable; NA = Not Available; W = Withheld to avoid disclosure of individual company data. |
| Release Date: 6/30/2026 |
| Next Release Date: 7/31/2026 |