|
Download Data (XLS File) |
|
|||||
|
|||||
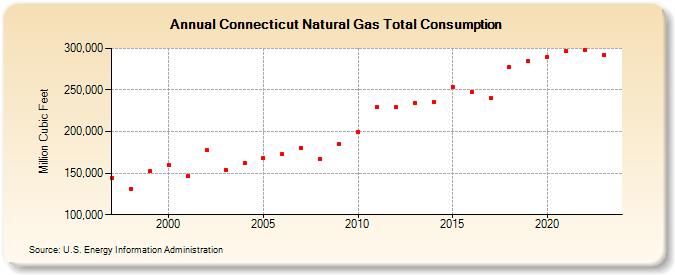
| Connecticut Natural Gas Total Consumption (Million Cubic Feet) | |||||
| Decade | Year-0 | Year-1 | Year-2 | Year-3 | Year-4 | Year-5 | Year-6 | Year-7 | Year-8 | Year-9 |
|---|---|---|---|---|---|---|---|---|---|---|
| 1990's | 144,708 | 131,497 | 152,237 | |||||||
| 2000's | 159,712 | 146,278 | 177,587 | 154,075 | 162,642 | 168,067 | 172,682 | 180,181 | 166,801 | 185,056 |
| 2010's | 199,426 | 230,036 | 229,156 | 234,475 | 235,859 | 254,065 | 247,958 | 239,818 | 277,931 | 284,610 |
| 2020's | 289,440 | 296,584 | 298,264 | 296,042 | 305,314 |
| - = No Data Reported; -- = Not Applicable; NA = Not Available; W = Withheld to avoid disclosure of individual company data. |
| Release Date: 6/30/2026 |
| Next Release Date: 7/31/2026 |