|
Download Data (XLS File) |
|
|||||
|
|||||
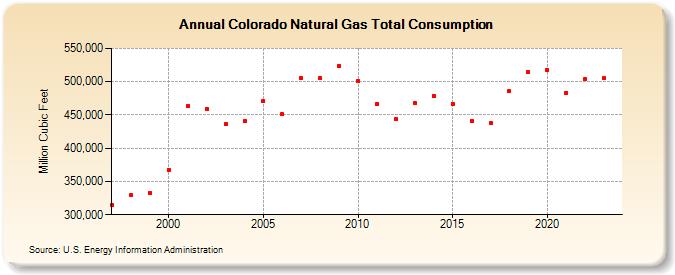
| Colorado Natural Gas Total Consumption (Million Cubic Feet) | |||||
| Decade | Year-0 | Year-1 | Year-2 | Year-3 | Year-4 | Year-5 | Year-6 | Year-7 | Year-8 | Year-9 |
|---|---|---|---|---|---|---|---|---|---|---|
| 1990's | 314,486 | 330,259 | 333,085 | |||||||
| 2000's | 367,920 | 463,738 | 459,397 | 436,253 | 440,378 | 470,321 | 450,832 | 504,775 | 504,783 | 523,726 |
| 2010's | 501,350 | 466,680 | 443,750 | 467,798 | 478,987 | 466,906 | 441,018 | 438,137 | 485,735 | 513,974 |
| 2020's | 517,367 | 483,240 | 503,407 | 506,355 | 503,348 |
| - = No Data Reported; -- = Not Applicable; NA = Not Available; W = Withheld to avoid disclosure of individual company data. |
| Release Date: 6/30/2026 |
| Next Release Date: 7/31/2026 |