|
Download Data (XLS File) |
|
|||||
|
|||||
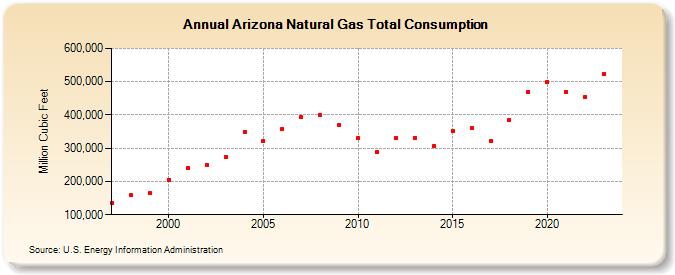
| Arizona Natural Gas Total Consumption (Million Cubic Feet) | |||||
| Decade | Year-0 | Year-1 | Year-2 | Year-3 | Year-4 | Year-5 | Year-6 | Year-7 | Year-8 | Year-9 |
|---|---|---|---|---|---|---|---|---|---|---|
| 1990's | 134,706 | 158,355 | 165,076 | |||||||
| 2000's | 205,235 | 240,812 | 250,734 | 272,921 | 349,622 | 321,584 | 358,069 | 392,954 | 399,188 | 369,739 |
| 2010's | 330,914 | 288,802 | 332,068 | 332,073 | 306,715 | 351,263 | 360,576 | 321,451 | 384,753 | 469,232 |
| 2020's | 499,552 | 469,470 | 453,965 | 523,039 | 538,671 |
| - = No Data Reported; -- = Not Applicable; NA = Not Available; W = Withheld to avoid disclosure of individual company data. |
| Release Date: 6/30/2026 |
| Next Release Date: 7/31/2026 |