|
Download Data (XLS File) |
|
|||||
|
|||||
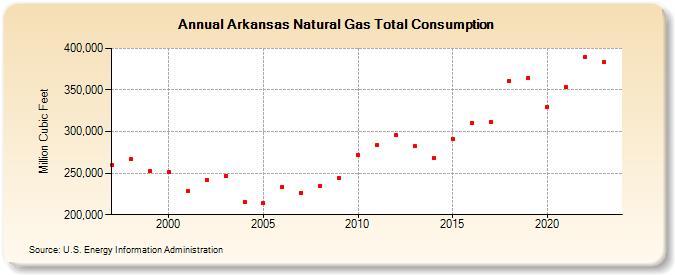
| Arkansas Natural Gas Total Consumption (Million Cubic Feet) | |||||
| Decade | Year-0 | Year-1 | Year-2 | Year-3 | Year-4 | Year-5 | Year-6 | Year-7 | Year-8 | Year-9 |
|---|---|---|---|---|---|---|---|---|---|---|
| 1990's | 260,113 | 266,485 | 252,853 | |||||||
| 2000's | 251,329 | 227,943 | 242,325 | 246,916 | 215,124 | 213,609 | 233,868 | 226,439 | 234,901 | 244,193 |
| 2010's | 271,515 | 284,076 | 296,132 | 282,120 | 268,444 | 291,006 | 309,732 | 311,609 | 360,804 | 364,821 |
| 2020's | 329,504 | 353,475 | 389,530 | 390,202 | 380,168 |
| - = No Data Reported; -- = Not Applicable; NA = Not Available; W = Withheld to avoid disclosure of individual company data. |
| Release Date: 6/30/2026 |
| Next Release Date: 7/31/2026 |