|
Download Data (XLS File) |
|
|||||
|
|||||
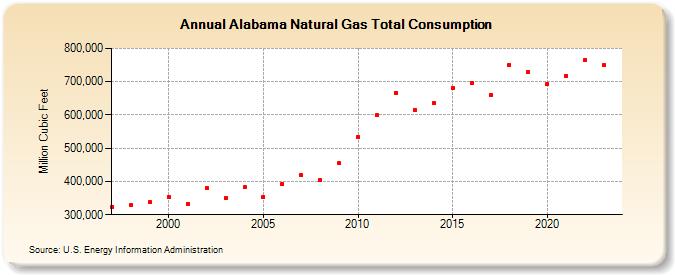
| Alabama Natural Gas Total Consumption (Million Cubic Feet) | |||||
| Decade | Year-0 | Year-1 | Year-2 | Year-3 | Year-4 | Year-5 | Year-6 | Year-7 | Year-8 | Year-9 |
|---|---|---|---|---|---|---|---|---|---|---|
| 1990's | 324,158 | 329,134 | 337,270 | |||||||
| 2000's | 353,614 | 332,693 | 379,343 | 350,345 | 382,367 | 353,156 | 391,093 | 418,512 | 404,157 | 454,456 |
| 2010's | 534,779 | 598,514 | 666,712 | 615,407 | 635,323 | 681,149 | 694,881 | 661,366 | 750,188 | 728,337 |
| 2020's | 693,377 | 717,643 | 763,627 | 751,871 | 773,724 |
| - = No Data Reported; -- = Not Applicable; NA = Not Available; W = Withheld to avoid disclosure of individual company data. |
| Release Date: 6/30/2026 |
| Next Release Date: 7/31/2026 |