|
Download Data (XLS File) |
|
|||||
|
|||||
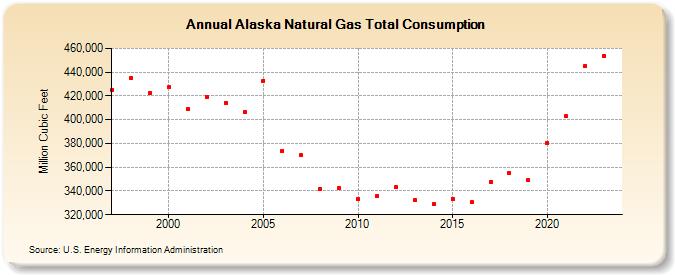
| Alaska Natural Gas Total Consumption (Million Cubic Feet) | |||||
| Decade | Year-0 | Year-1 | Year-2 | Year-3 | Year-4 | Year-5 | Year-6 | Year-7 | Year-8 | Year-9 |
|---|---|---|---|---|---|---|---|---|---|---|
| 1990's | 425,393 | 434,871 | 422,816 | |||||||
| 2000's | 427,288 | 408,960 | 419,131 | 414,234 | 406,319 | 432,972 | 373,850 | 369,967 | 341,888 | 342,261 |
| 2010's | 333,312 | 335,458 | 343,110 | 332,298 | 328,945 | 333,602 | 330,552 | 347,725 | 355,132 | 348,968 |
| 2020's | 380,265 | 402,840 | 445,036 | 448,984 | 459,212 |
| - = No Data Reported; -- = Not Applicable; NA = Not Available; W = Withheld to avoid disclosure of individual company data. |
| Release Date: 6/30/2026 |
| Next Release Date: 7/31/2026 |