|
Download Data (XLS File) |
|
|||||
|
|||||
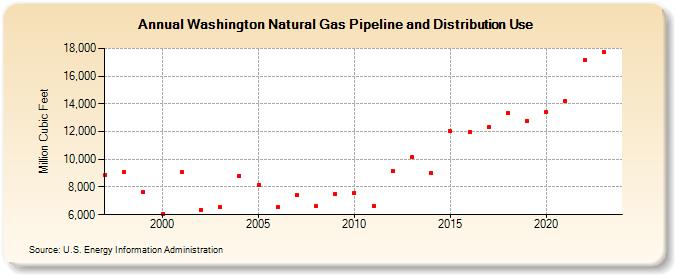
| Washington Natural Gas Pipeline and Distribution Use (Million Cubic Feet) | |||||
| Decade | Year-0 | Year-1 | Year-2 | Year-3 | Year-4 | Year-5 | Year-6 | Year-7 | Year-8 | Year-9 |
|---|---|---|---|---|---|---|---|---|---|---|
| 1990's | 8,836 | 9,087 | 7,645 | |||||||
| 2000's | 6,036 | 9,053 | 6,356 | 6,527 | 8,822 | 8,174 | 6,554 | 7,402 | 6,605 | 7,497 |
| 2010's | 7,587 | 6,644 | 9,184 | 10,144 | 9,015 | 12,020 | 11,965 | 12,311 | 13,372 | 12,797 |
| 2020's | 13,394 | 14,175 | 17,153 | 17,772 | 17,219 |
| - = No Data Reported; -- = Not Applicable; NA = Not Available; W = Withheld to avoid disclosure of individual company data. |
| Release Date: 6/30/2026 |
| Next Release Date: 7/31/2026 |