|
Download Data (XLS File) |
|
|||||
|
|||||
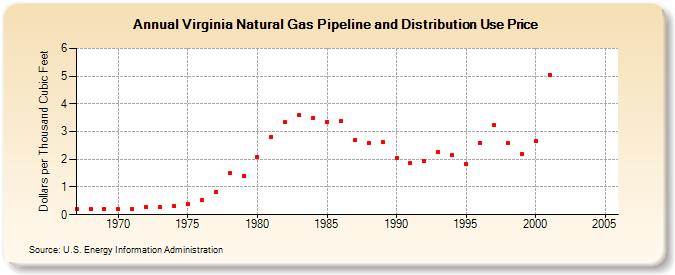
| Virginia Natural Gas Pipeline and Distribution Use Price (Dollars per Thousand Cubic Feet) | |||||
| Decade | Year-0 | Year-1 | Year-2 | Year-3 | Year-4 | Year-5 | Year-6 | Year-7 | Year-8 | Year-9 |
|---|---|---|---|---|---|---|---|---|---|---|
| 1960's | 0.20 | 0.20 | 0.20 | |||||||
| 1970's | 0.20 | 0.22 | 0.27 | 0.28 | 0.31 | 0.38 | 0.53 | 0.81 | 1.49 | 1.40 |
| 1980's | 2.09 | 2.81 | 3.33 | 3.59 | 3.49 | 3.35 | 3.37 | 2.68 | 2.59 | 2.63 |
| 1990's | 2.05 | 1.86 | 1.93 | 2.27 | 2.14 | 1.83 | 2.60 | 3.22 | 2.59 | 2.20 |
| 2000's | 2.66 | 5.05 | NA | -- | -- | -- |
| - = No Data Reported; -- = Not Applicable; NA = Not Available; W = Withheld to avoid disclosure of individual company data. |
| Release Date: 6/30/2026 |
| Next Release Date: 7/31/2026 |