|
Download Data (XLS File) |
|
|||||
|
|||||
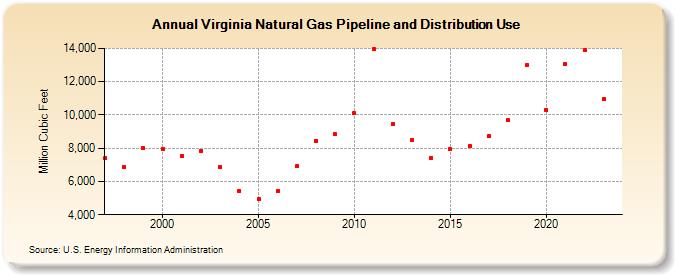
| Virginia Natural Gas Pipeline and Distribution Use (Million Cubic Feet) | |||||
| Decade | Year-0 | Year-1 | Year-2 | Year-3 | Year-4 | Year-5 | Year-6 | Year-7 | Year-8 | Year-9 |
|---|---|---|---|---|---|---|---|---|---|---|
| 1990's | 7,387 | 6,856 | 8,005 | |||||||
| 2000's | 7,975 | 7,542 | 7,851 | 6,854 | 5,452 | 4,954 | 5,412 | 6,905 | 8,461 | 8,829 |
| 2010's | 10,091 | 13,957 | 9,443 | 8,475 | 7,424 | 7,945 | 8,106 | 8,708 | 9,685 | 13,005 |
| 2020's | 10,285 | 13,032 | 13,918 | 10,970 | 11,974 |
| - = No Data Reported; -- = Not Applicable; NA = Not Available; W = Withheld to avoid disclosure of individual company data. |
| Release Date: 6/30/2026 |
| Next Release Date: 7/31/2026 |