|
Download Data (XLS File) |
|
|||||
|
|||||
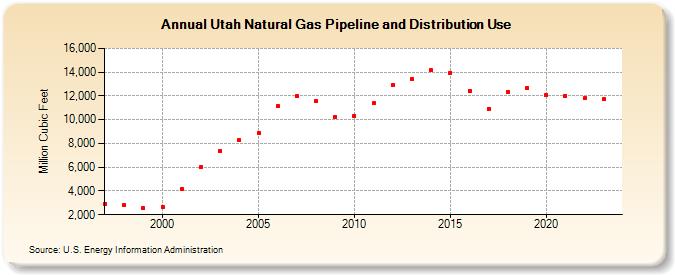
| Utah Natural Gas Pipeline and Distribution Use (Million Cubic Feet) | |||||
| Decade | Year-0 | Year-1 | Year-2 | Year-3 | Year-4 | Year-5 | Year-6 | Year-7 | Year-8 | Year-9 |
|---|---|---|---|---|---|---|---|---|---|---|
| 1990's | 2,935 | 2,788 | 2,561 | |||||||
| 2000's | 2,674 | 4,161 | 5,984 | 7,347 | 8,278 | 8,859 | 11,156 | 11,970 | 11,532 | 10,239 |
| 2010's | 10,347 | 11,374 | 12,902 | 13,441 | 14,152 | 13,962 | 12,427 | 10,934 | 12,316 | 12,707 |
| 2020's | 12,080 | 12,002 | 11,810 | 11,725 | 10,507 |
| - = No Data Reported; -- = Not Applicable; NA = Not Available; W = Withheld to avoid disclosure of individual company data. |
| Release Date: 6/30/2026 |
| Next Release Date: 7/31/2026 |