|
Download Data (XLS File) |
|
|||||
|
|||||
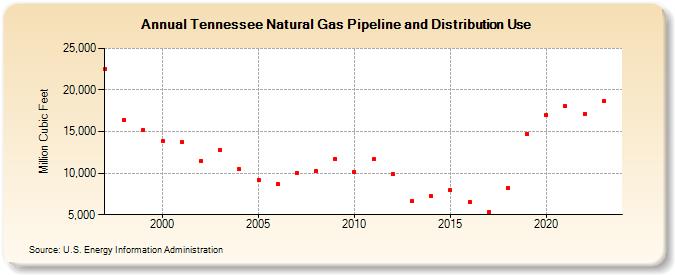
| Tennessee Natural Gas Pipeline and Distribution Use (Million Cubic Feet) | |||||
| Decade | Year-0 | Year-1 | Year-2 | Year-3 | Year-4 | Year-5 | Year-6 | Year-7 | Year-8 | Year-9 |
|---|---|---|---|---|---|---|---|---|---|---|
| 1990's | 22,559 | 16,440 | 15,208 | |||||||
| 2000's | 13,808 | 13,757 | 11,480 | 12,785 | 10,486 | 9,182 | 8,696 | 9,988 | 10,238 | 11,720 |
| 2010's | 10,081 | 11,655 | 9,880 | 6,660 | 7,213 | 7,940 | 6,588 | 5,290 | 8,193 | 14,712 |
| 2020's | 16,980 | 18,028 | 17,156 | 18,635 | 18,206 |
| - = No Data Reported; -- = Not Applicable; NA = Not Available; W = Withheld to avoid disclosure of individual company data. |
| Release Date: 6/30/2026 |
| Next Release Date: 7/31/2026 |