|
Download Data (XLS File) |
|
|||||
|
|||||
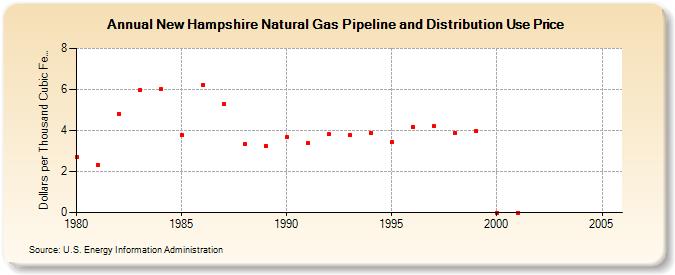
| New Hampshire Natural Gas Pipeline and Distribution Use Price (Dollars per Thousand Cubic Feet) | |||||
| Decade | Year-0 | Year-1 | Year-2 | Year-3 | Year-4 | Year-5 | Year-6 | Year-7 | Year-8 | Year-9 |
|---|---|---|---|---|---|---|---|---|---|---|
| 1980's | 2.73 | 2.32 | 4.82 | 5.95 | 6.00 | 3.77 | 6.23 | 5.29 | 3.33 | 3.26 |
| 1990's | 3.67 | 3.40 | 3.81 | 3.79 | 3.88 | 3.42 | 4.17 | 4.20 | 3.88 | 3.97 |
| 2000's | 0.00 | 0.00 | NA | -- | -- | -- |
| - = No Data Reported; -- = Not Applicable; NA = Not Available; W = Withheld to avoid disclosure of individual company data. |
| Release Date: 6/30/2026 |
| Next Release Date: 7/31/2026 |