|
Download Data (XLS File) |
|
|||||
|
|||||
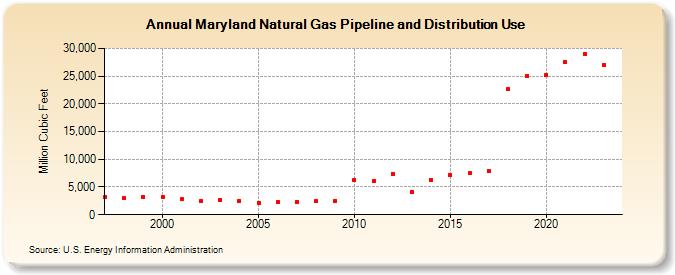
| Maryland Natural Gas Pipeline and Distribution Use (Million Cubic Feet) | |||||
| Decade | Year-0 | Year-1 | Year-2 | Year-3 | Year-4 | Year-5 | Year-6 | Year-7 | Year-8 | Year-9 |
|---|---|---|---|---|---|---|---|---|---|---|
| 1990's | 3,124 | 2,968 | 3,207 | |||||||
| 2000's | 3,239 | 2,765 | 2,511 | 2,743 | 2,483 | 2,173 | 2,346 | 2,339 | 2,454 | 2,521 |
| 2010's | 6,332 | 6,065 | 7,397 | 4,125 | 6,345 | 7,190 | 7,445 | 7,968 | 22,661 | 25,106 |
| 2020's | 25,177 | 27,475 | 28,998 | 27,068 | 29,837 |
| - = No Data Reported; -- = Not Applicable; NA = Not Available; W = Withheld to avoid disclosure of individual company data. |
| Release Date: 6/30/2026 |
| Next Release Date: 7/31/2026 |