|
Download Data (XLS File) |
|
|||||
|
|||||
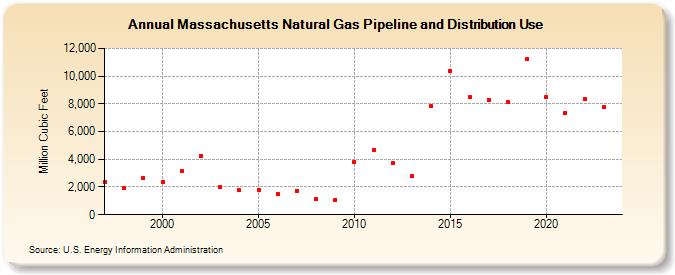
| Massachusetts Natural Gas Pipeline and Distribution Use (Million Cubic Feet) | |||||
| Decade | Year-0 | Year-1 | Year-2 | Year-3 | Year-4 | Year-5 | Year-6 | Year-7 | Year-8 | Year-9 |
|---|---|---|---|---|---|---|---|---|---|---|
| 1990's | 2,356 | 1,903 | 2,655 | |||||||
| 2000's | 2,391 | 3,187 | 4,222 | 1,988 | 1,755 | 1,810 | 1,499 | 1,737 | 1,157 | 1,093 |
| 2010's | 3,827 | 4,657 | 3,712 | 2,759 | 7,810 | 10,340 | 8,498 | 8,261 | 8,139 | 11,235 |
| 2020's | 8,487 | 7,342 | 8,364 | 7,773 | 8,575 |
| - = No Data Reported; -- = Not Applicable; NA = Not Available; W = Withheld to avoid disclosure of individual company data. |
| Release Date: 6/30/2026 |
| Next Release Date: 7/31/2026 |