|
Download Data (XLS File) |
|
|||||
|
|||||
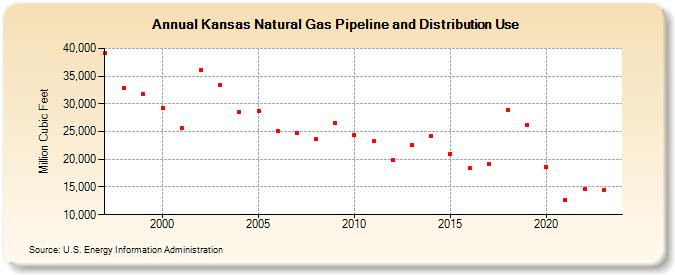
| Kansas Natural Gas Pipeline and Distribution Use (Million Cubic Feet) | |||||
| Decade | Year-0 | Year-1 | Year-2 | Year-3 | Year-4 | Year-5 | Year-6 | Year-7 | Year-8 | Year-9 |
|---|---|---|---|---|---|---|---|---|---|---|
| 1990's | 39,109 | 32,902 | 31,753 | |||||||
| 2000's | 29,330 | 25,606 | 36,127 | 33,343 | 28,608 | 28,752 | 25,050 | 24,773 | 23,589 | 26,479 |
| 2010's | 24,305 | 23,225 | 19,842 | 22,586 | 24,225 | 21,040 | 18,343 | 19,209 | 28,863 | 26,157 |
| 2020's | 18,603 | 12,679 | 14,666 | 14,526 | 14,093 |
| - = No Data Reported; -- = Not Applicable; NA = Not Available; W = Withheld to avoid disclosure of individual company data. |
| Release Date: 6/30/2026 |
| Next Release Date: 7/31/2026 |