|
Download Data (XLS File) |
|
|||||
|
|||||
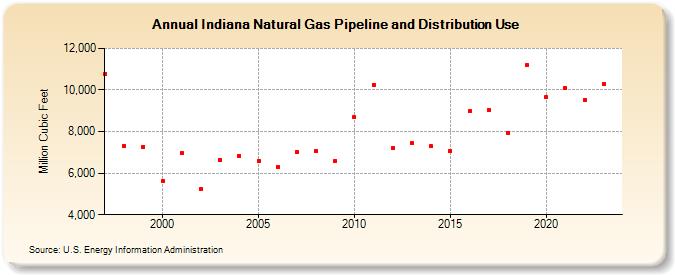
| Indiana Natural Gas Pipeline and Distribution Use (Million Cubic Feet) | |||||
| Decade | Year-0 | Year-1 | Year-2 | Year-3 | Year-4 | Year-5 | Year-6 | Year-7 | Year-8 | Year-9 |
|---|---|---|---|---|---|---|---|---|---|---|
| 1990's | 10,773 | 7,327 | 7,274 | |||||||
| 2000's | 5,617 | 6,979 | 5,229 | 6,647 | 6,842 | 6,599 | 6,313 | 7,039 | 7,060 | 6,597 |
| 2010's | 8,679 | 10,259 | 7,206 | 7,428 | 7,282 | 7,071 | 8,983 | 9,040 | 7,946 | 11,203 |
| 2020's | 9,643 | 10,100 | 9,506 | 10,303 | 10,675 |
| - = No Data Reported; -- = Not Applicable; NA = Not Available; W = Withheld to avoid disclosure of individual company data. |
| Release Date: 6/30/2026 |
| Next Release Date: 7/31/2026 |