|
Download Data (XLS File) |
|
|||||
|
|||||
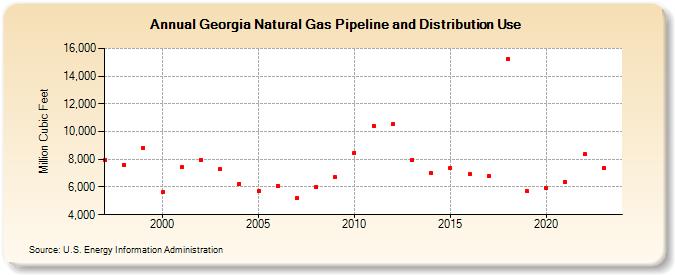
| Georgia Natural Gas Pipeline and Distribution Use (Million Cubic Feet) | |||||
| Decade | Year-0 | Year-1 | Year-2 | Year-3 | Year-4 | Year-5 | Year-6 | Year-7 | Year-8 | Year-9 |
|---|---|---|---|---|---|---|---|---|---|---|
| 1990's | 7,973 | 7,606 | 8,846 | |||||||
| 2000's | 5,636 | 7,411 | 7,979 | 7,268 | 6,235 | 5,708 | 6,092 | 5,188 | 5,986 | 6,717 |
| 2010's | 8,473 | 10,432 | 10,509 | 7,973 | 6,977 | 7,392 | 6,911 | 6,794 | 15,239 | 5,691 |
| 2020's | 5,911 | 6,372 | 8,353 | 10,922 | 10,398 |
| - = No Data Reported; -- = Not Applicable; NA = Not Available; W = Withheld to avoid disclosure of individual company data. |
| Release Date: 6/30/2026 |
| Next Release Date: 7/31/2026 |