|
Download Data (XLS File) |
|
|||||
|
|||||
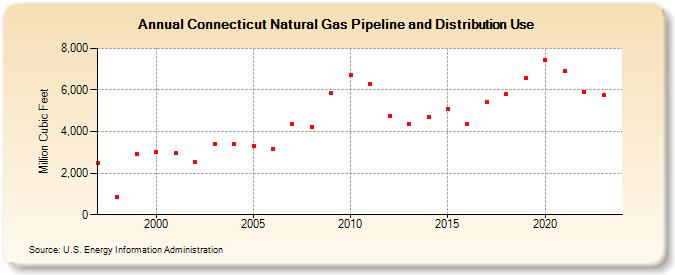
| Connecticut Natural Gas Pipeline and Distribution Use (Million Cubic Feet) | |||||
| Decade | Year-0 | Year-1 | Year-2 | Year-3 | Year-4 | Year-5 | Year-6 | Year-7 | Year-8 | Year-9 |
|---|---|---|---|---|---|---|---|---|---|---|
| 1990's | 2,492 | 833 | 2,943 | |||||||
| 2000's | 3,020 | 2,948 | 2,515 | 3,382 | 3,383 | 3,327 | 3,178 | 4,361 | 4,225 | 5,831 |
| 2010's | 6,739 | 6,302 | 4,747 | 4,381 | 4,696 | 5,103 | 4,340 | 5,414 | 5,792 | 6,567 |
| 2020's | 7,465 | 6,936 | 5,909 | 5,765 | 5,904 |
| - = No Data Reported; -- = Not Applicable; NA = Not Available; W = Withheld to avoid disclosure of individual company data. |
| Release Date: 6/30/2026 |
| Next Release Date: 7/31/2026 |