|
Download Data (XLS File) |
|
|||||
|
|||||
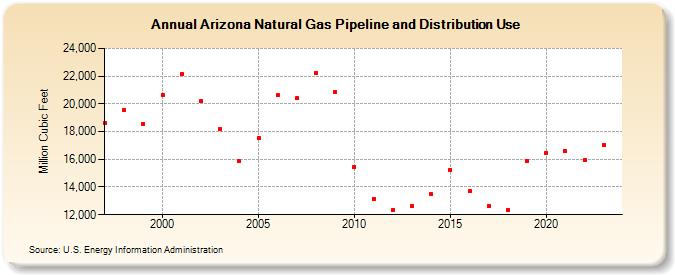
| Arizona Natural Gas Pipeline and Distribution Use (Million Cubic Feet) | |||||
| Decade | Year-0 | Year-1 | Year-2 | Year-3 | Year-4 | Year-5 | Year-6 | Year-7 | Year-8 | Year-9 |
|---|---|---|---|---|---|---|---|---|---|---|
| 1990's | 18,597 | 19,585 | 18,570 | |||||||
| 2000's | 20,657 | 22,158 | 20,183 | 18,183 | 15,850 | 17,558 | 20,617 | 20,397 | 22,207 | 20,846 |
| 2010's | 15,447 | 13,158 | 12,372 | 12,619 | 13,484 | 15,228 | 13,708 | 12,646 | 12,338 | 15,902 |
| 2020's | 16,461 | 16,586 | 15,935 | 17,060 | 16,868 |
| - = No Data Reported; -- = Not Applicable; NA = Not Available; W = Withheld to avoid disclosure of individual company data. |
| Release Date: 6/30/2026 |
| Next Release Date: 7/31/2026 |