|
Download Data (XLS File) |
|
|||||
|
|||||
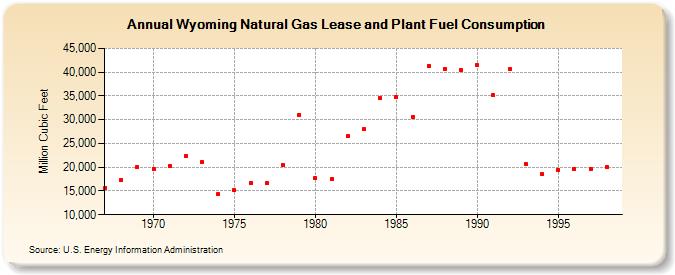
| Wyoming Natural Gas Lease and Plant Fuel Consumption (Million Cubic Feet) | |||||
| Decade | Year-0 | Year-1 | Year-2 | Year-3 | Year-4 | Year-5 | Year-6 | Year-7 | Year-8 | Year-9 |
|---|---|---|---|---|---|---|---|---|---|---|
| 1960's | 15,722 | 17,271 | 19,964 | |||||||
| 1970's | 19,625 | 20,348 | 22,402 | 21,151 | 14,302 | 15,102 | 16,726 | 16,601 | 20,363 | 31,081 |
| 1980's | 17,763 | 17,527 | 26,559 | 28,010 | 34,459 | 34,709 | 30,599 | 41,371 | 40,698 | 40,361 |
| 1990's | 41,415 | 35,142 | 40,599 | 20,643 | 18,615 | 19,466 | 19,661 | 19,696 | 20,001 |
| - = No Data Reported; -- = Not Applicable; NA = Not Available; W = Withheld to avoid disclosure of individual company data. |
| Release Date: 6/30/2026 |
| Next Release Date: 7/31/2026 |