|
Download Data (XLS File) |
|
|||||
|
|||||
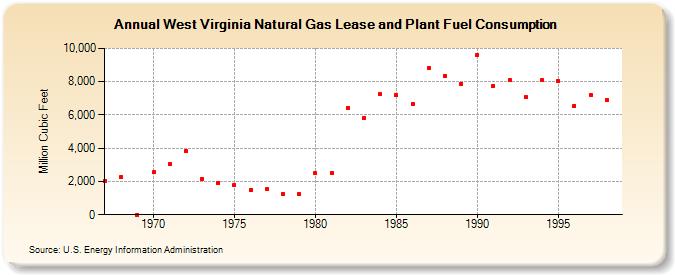
| West Virginia Natural Gas Lease and Plant Fuel Consumption (Million Cubic Feet) | |||||
| Decade | Year-0 | Year-1 | Year-2 | Year-3 | Year-4 | Year-5 | Year-6 | Year-7 | Year-8 | Year-9 |
|---|---|---|---|---|---|---|---|---|---|---|
| 1960's | 2,052 | 2,276 | 0 | |||||||
| 1970's | 2,551 | 3,043 | 3,808 | 2,160 | 1,909 | 1,791 | 1,490 | 1,527 | 1,233 | 1,218 |
| 1980's | 2,482 | 2,515 | 6,426 | 5,826 | 7,232 | 7,190 | 6,658 | 8,835 | 8,343 | 7,882 |
| 1990's | 9,631 | 7,744 | 8,097 | 7,065 | 8,087 | 8,045 | 6,554 | 7,210 | 6,893 |
| - = No Data Reported; -- = Not Applicable; NA = Not Available; W = Withheld to avoid disclosure of individual company data. |
| Release Date: 6/30/2026 |
| Next Release Date: 7/31/2026 |