|
Download Data (XLS File) |
|
|||||
|
|||||
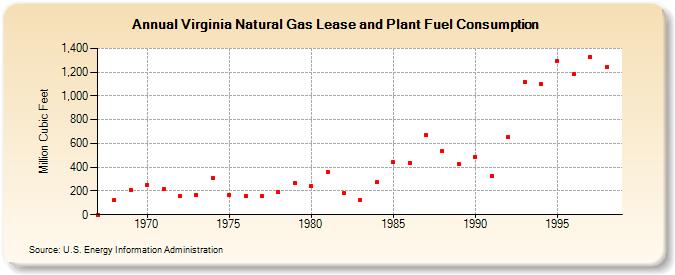
| Virginia Natural Gas Lease and Plant Fuel Consumption (Million Cubic Feet) | |||||
| Decade | Year-0 | Year-1 | Year-2 | Year-3 | Year-4 | Year-5 | Year-6 | Year-7 | Year-8 | Year-9 |
|---|---|---|---|---|---|---|---|---|---|---|
| 1960's | 0 | 128 | 211 | |||||||
| 1970's | 252 | 213 | 157 | 170 | 307 | 168 | 157 | 157 | 191 | 266 |
| 1980's | 240 | 361 | 181 | 124 | 272 | 443 | 438 | 669 | 536 | 425 |
| 1990's | 489 | 327 | 653 | 1,120 | 1,102 | 1,296 | 1,183 | 1,330 | 1,243 |
| - = No Data Reported; -- = Not Applicable; NA = Not Available; W = Withheld to avoid disclosure of individual company data. |
| Release Date: 6/30/2026 |
| Next Release Date: 7/31/2026 |