|
Download Data (XLS File) |
|
|||||
|
|||||
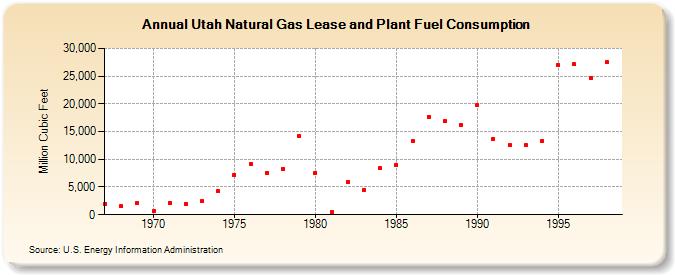
| Utah Natural Gas Lease and Plant Fuel Consumption (Million Cubic Feet) | |||||
| Decade | Year-0 | Year-1 | Year-2 | Year-3 | Year-4 | Year-5 | Year-6 | Year-7 | Year-8 | Year-9 |
|---|---|---|---|---|---|---|---|---|---|---|
| 1960's | 1,956 | 1,503 | 2,113 | |||||||
| 1970's | 633 | 2,115 | 1,978 | 2,435 | 4,193 | 7,240 | 9,150 | 7,585 | 8,325 | 14,123 |
| 1980's | 7,594 | 511 | 5,965 | 4,538 | 8,375 | 9,001 | 13,289 | 17,671 | 16,889 | 16,211 |
| 1990's | 19,719 | 13,738 | 12,611 | 12,526 | 13,273 | 27,012 | 27,119 | 24,619 | 27,466 |
| - = No Data Reported; -- = Not Applicable; NA = Not Available; W = Withheld to avoid disclosure of individual company data. |
| Release Date: 6/30/2026 |
| Next Release Date: 7/31/2026 |