|
Download Data (XLS File) |
|
|||||
|
|||||
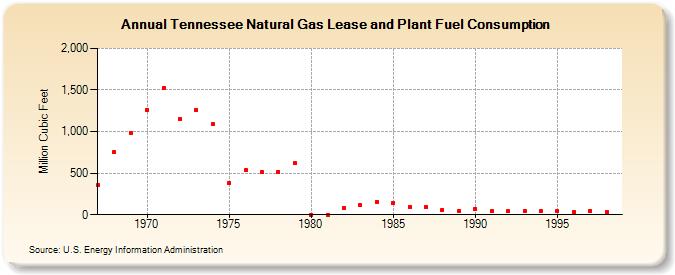
| Tennessee Natural Gas Lease and Plant Fuel Consumption (Million Cubic Feet) | |||||
| Decade | Year-0 | Year-1 | Year-2 | Year-3 | Year-4 | Year-5 | Year-6 | Year-7 | Year-8 | Year-9 |
|---|---|---|---|---|---|---|---|---|---|---|
| 1960's | 355 | 753 | 986 | |||||||
| 1970's | 1,265 | 1,524 | 1,150 | 1,263 | 1,087 | 387 | 537 | 509 | 516 | 616 |
| 1980's | 0 | 0 | 78 | 113 | 153 | 138 | 98 | 93 | 60 | 45 |
| 1990's | 74 | 44 | 39 | 49 | 44 | 47 | 37 | 45 | 31 |
| - = No Data Reported; -- = Not Applicable; NA = Not Available; W = Withheld to avoid disclosure of individual company data. |
| Release Date: 6/30/2026 |
| Next Release Date: 7/31/2026 |