|
Download Data (XLS File) |
|
|||||
|
|||||
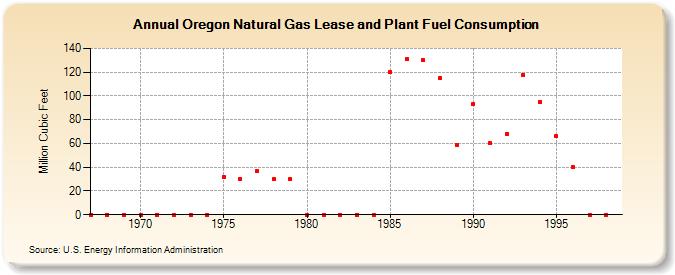
| Oregon Natural Gas Lease and Plant Fuel Consumption (Million Cubic Feet) | |||||
| Decade | Year-0 | Year-1 | Year-2 | Year-3 | Year-4 | Year-5 | Year-6 | Year-7 | Year-8 | Year-9 |
|---|---|---|---|---|---|---|---|---|---|---|
| 1960's | 0 | 0 | 0 | |||||||
| 1970's | 0 | 0 | 0 | 0 | 0 | 32 | 30 | 37 | 30 | 30 |
| 1980's | 0 | 0 | 0 | 0 | 0 | 120 | 131 | 130 | 115 | 59 |
| 1990's | 93 | 60 | 68 | 118 | 95 | 66 | 40 | 0 | 0 |
| - = No Data Reported; -- = Not Applicable; NA = Not Available; W = Withheld to avoid disclosure of individual company data. |
| Release Date: 6/30/2026 |
| Next Release Date: 7/31/2026 |