|
Download Data (XLS File) |
|
|||||
|
|||||
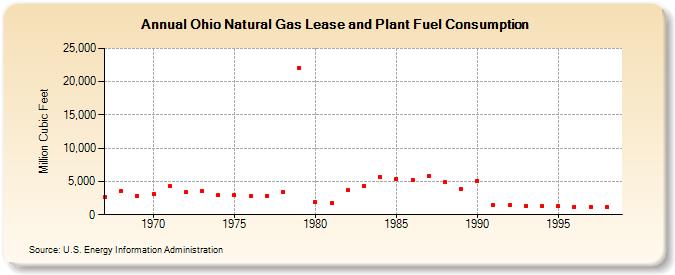
| Ohio Natural Gas Lease and Plant Fuel Consumption (Million Cubic Feet) | |||||
| Decade | Year-0 | Year-1 | Year-2 | Year-3 | Year-4 | Year-5 | Year-6 | Year-7 | Year-8 | Year-9 |
|---|---|---|---|---|---|---|---|---|---|---|
| 1960's | 2,656 | 3,505 | 2,879 | |||||||
| 1970's | 3,140 | 4,302 | 3,397 | 3,548 | 2,957 | 2,925 | 2,742 | 2,814 | 3,477 | 22,094 |
| 1980's | 1,941 | 1,776 | 3,671 | 4,377 | 5,741 | 5,442 | 5,243 | 5,802 | 4,869 | 3,876 |
| 1990's | 5,129 | 1,476 | 1,450 | 1,366 | 1,332 | 1,283 | 1,230 | 1,201 | 1,125 |
| - = No Data Reported; -- = Not Applicable; NA = Not Available; W = Withheld to avoid disclosure of individual company data. |
| Release Date: 6/30/2026 |
| Next Release Date: 7/31/2026 |