|
Download Data (XLS File) |
|
|||||
|
|||||
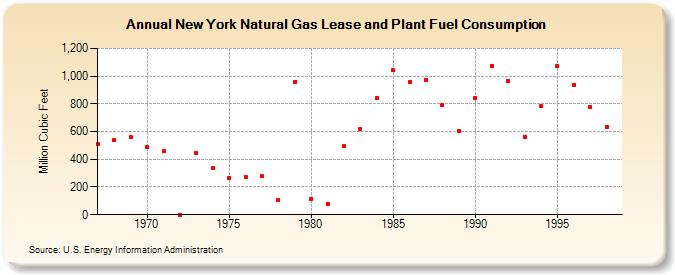
| New York Natural Gas Lease and Plant Fuel Consumption (Million Cubic Feet) | |||||
| Decade | Year-0 | Year-1 | Year-2 | Year-3 | Year-4 | Year-5 | Year-6 | Year-7 | Year-8 | Year-9 |
|---|---|---|---|---|---|---|---|---|---|---|
| 1960's | 508 | 538 | 561 | |||||||
| 1970's | 485 | 460 | 0 | 442 | 340 | 267 | 273 | 278 | 109 | 961 |
| 1980's | 115 | 80 | 494 | 617 | 840 | 1,041 | 957 | 975 | 788 | 604 |
| 1990's | 840 | 1,073 | 965 | 563 | 781 | 1,074 | 939 | 778 | 636 |
| - = No Data Reported; -- = Not Applicable; NA = Not Available; W = Withheld to avoid disclosure of individual company data. |
| Release Date: 6/30/2026 |
| Next Release Date: 7/31/2026 |