|
Download Data (XLS File) |
|
|||||
|
|||||
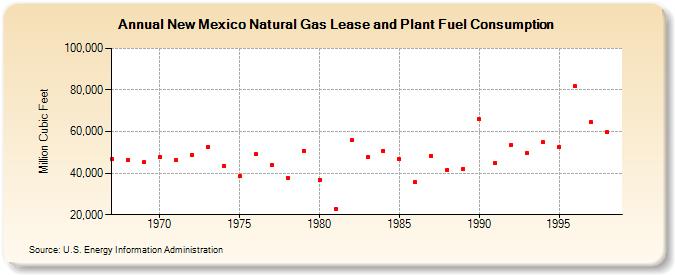
| New Mexico Natural Gas Lease and Plant Fuel Consumption (Million Cubic Feet) | |||||
| Decade | Year-0 | Year-1 | Year-2 | Year-3 | Year-4 | Year-5 | Year-6 | Year-7 | Year-8 | Year-9 |
|---|---|---|---|---|---|---|---|---|---|---|
| 1960's | 46,793 | 46,331 | 45,309 | |||||||
| 1970's | 47,998 | 46,114 | 48,803 | 52,553 | 43,452 | 38,604 | 49,160 | 43,751 | 37,880 | 50,798 |
| 1980's | 36,859 | 22,685 | 55,722 | 47,630 | 50,662 | 46,709 | 35,615 | 48,138 | 41,706 | 42,224 |
| 1990's | 65,889 | 44,766 | 53,697 | 49,658 | 54,786 | 52,589 | 81,751 | 64,458 | 59,654 |
| - = No Data Reported; -- = Not Applicable; NA = Not Available; W = Withheld to avoid disclosure of individual company data. |
| Release Date: 6/30/2026 |
| Next Release Date: 7/31/2026 |