|
Download Data (XLS File) |
|
|||||
|
|||||
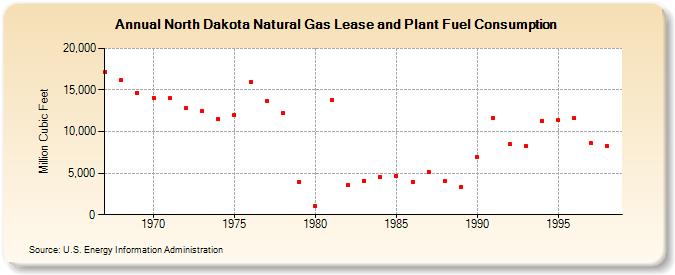
| North Dakota Natural Gas Lease and Plant Fuel Consumption (Million Cubic Feet) | |||||
| Decade | Year-0 | Year-1 | Year-2 | Year-3 | Year-4 | Year-5 | Year-6 | Year-7 | Year-8 | Year-9 |
|---|---|---|---|---|---|---|---|---|---|---|
| 1960's | 17,133 | 16,163 | 14,691 | |||||||
| 1970's | 14,067 | 13,990 | 12,773 | 12,462 | 11,483 | 12,008 | 15,998 | 13,697 | 12,218 | 3,950 |
| 1980's | 1,017 | 13,759 | 3,514 | 4,100 | 4,563 | 4,710 | 3,974 | 5,194 | 4,014 | 3,388 |
| 1990's | 6,939 | 11,583 | 8,462 | 8,256 | 11,306 | 11,342 | 11,603 | 8,572 | 8,309 |
| - = No Data Reported; -- = Not Applicable; NA = Not Available; W = Withheld to avoid disclosure of individual company data. |
| Release Date: 6/30/2026 |
| Next Release Date: 7/31/2026 |