|
Download Data (XLS File) |
|
|||||
|
|||||
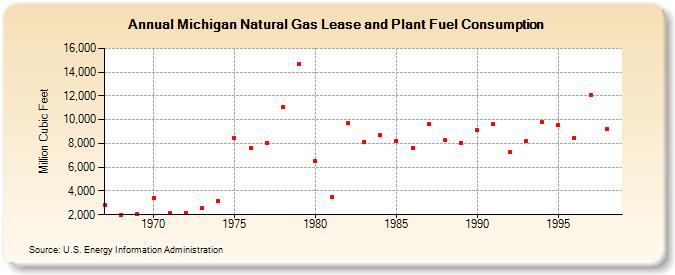
| Michigan Natural Gas Lease and Plant Fuel Consumption (Million Cubic Feet) | |||||
| Decade | Year-0 | Year-1 | Year-2 | Year-3 | Year-4 | Year-5 | Year-6 | Year-7 | Year-8 | Year-9 |
|---|---|---|---|---|---|---|---|---|---|---|
| 1960's | 2,798 | 2,012 | 2,074 | |||||||
| 1970's | 3,440 | 2,145 | 2,143 | 2,551 | 3,194 | 8,420 | 7,647 | 8,022 | 11,076 | 14,695 |
| 1980's | 6,494 | 3,461 | 9,699 | 8,130 | 8,710 | 8,195 | 7,609 | 9,616 | 8,250 | 8,003 |
| 1990's | 9,094 | 9,595 | 7,274 | 8,171 | 9,766 | 9,535 | 8,489 | 12,060 | 9,233 |
| - = No Data Reported; -- = Not Applicable; NA = Not Available; W = Withheld to avoid disclosure of individual company data. |
| Release Date: 6/30/2026 |
| Next Release Date: 7/31/2026 |