|
Download Data (XLS File) |
|
|||||
|
|||||
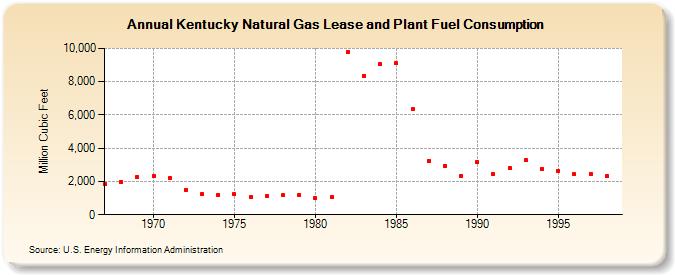
| Kentucky Natural Gas Lease and Plant Fuel Consumption (Million Cubic Feet) | |||||
| Decade | Year-0 | Year-1 | Year-2 | Year-3 | Year-4 | Year-5 | Year-6 | Year-7 | Year-8 | Year-9 |
|---|---|---|---|---|---|---|---|---|---|---|
| 1960's | 1,828 | 1,992 | 2,277 | |||||||
| 1970's | 2,317 | 2,212 | 1,509 | 1,238 | 1,206 | 1,218 | 1,040 | 1,107 | 1,160 | 1,214 |
| 1980's | 989 | 1,040 | 9,772 | 8,361 | 9,038 | 9,095 | 6,335 | 3,254 | 2,942 | 2,345 |
| 1990's | 3,149 | 2,432 | 2,812 | 3,262 | 2,773 | 2,647 | 2,426 | 2,457 | 2,325 |
| - = No Data Reported; -- = Not Applicable; NA = Not Available; W = Withheld to avoid disclosure of individual company data. |
| Release Date: 6/30/2026 |
| Next Release Date: 7/31/2026 |