|
Download Data (XLS File) |
|
|||||
|
|||||
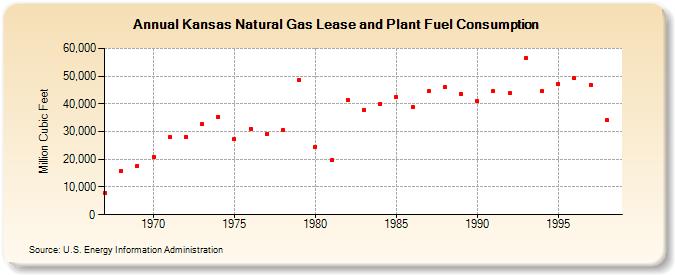
| Kansas Natural Gas Lease and Plant Fuel Consumption (Million Cubic Feet) | |||||
| Decade | Year-0 | Year-1 | Year-2 | Year-3 | Year-4 | Year-5 | Year-6 | Year-7 | Year-8 | Year-9 |
|---|---|---|---|---|---|---|---|---|---|---|
| 1960's | 7,842 | 15,867 | 17,587 | |||||||
| 1970's | 20,841 | 27,972 | 28,183 | 32,663 | 35,350 | 27,212 | 31,044 | 29,142 | 30,491 | 48,663 |
| 1980's | 24,521 | 19,665 | 41,392 | 37,901 | 40,105 | 42,457 | 38,885 | 44,505 | 45,928 | 43,630 |
| 1990's | 40,914 | 44,614 | 43,736 | 56,657 | 44,611 | 47,282 | 49,196 | 46,846 | 33,989 |
| - = No Data Reported; -- = Not Applicable; NA = Not Available; W = Withheld to avoid disclosure of individual company data. |
| Release Date: 6/30/2026 |
| Next Release Date: 7/31/2026 |