|
Download Data (XLS File) |
|
|||||
|
|||||
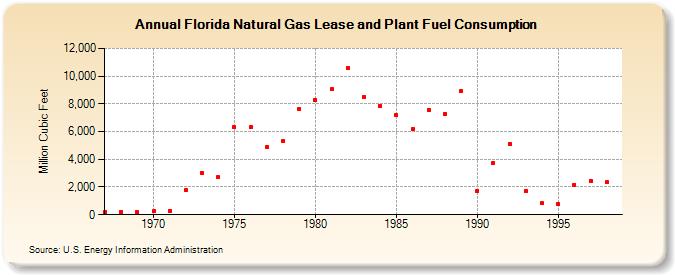
| Florida Natural Gas Lease and Plant Fuel Consumption (Million Cubic Feet) | |||||
| Decade | Year-0 | Year-1 | Year-2 | Year-3 | Year-4 | Year-5 | Year-6 | Year-7 | Year-8 | Year-9 |
|---|---|---|---|---|---|---|---|---|---|---|
| 1960's | 210 | 201 | 176 | |||||||
| 1970's | 234 | 294 | 1,782 | 3,027 | 2,700 | 6,304 | 6,306 | 4,890 | 5,314 | 7,628 |
| 1980's | 8,284 | 9,035 | 10,603 | 8,520 | 7,847 | 7,174 | 6,156 | 7,563 | 7,275 | 8,942 |
| 1990's | 1,716 | 3,751 | 5,134 | 1,717 | 820 | 765 | 2,174 | 2,434 | 2,329 |
| - = No Data Reported; -- = Not Applicable; NA = Not Available; W = Withheld to avoid disclosure of individual company data. |
| Release Date: 6/30/2026 |
| Next Release Date: 7/31/2026 |