|
Download Data (XLS File) |
|
||||||||
|
||||||||
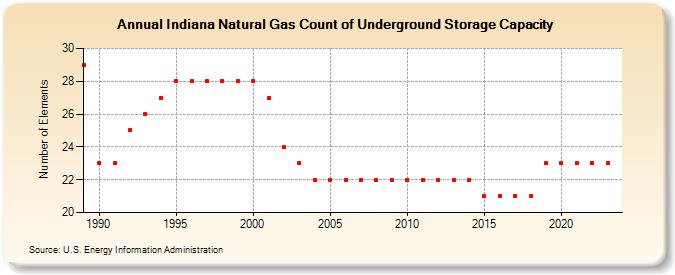
| Indiana Natural Gas Count of Underground Storage Capacity (Number of Elements) | ||||||||
| Decade | Year-0 | Year-1 | Year-2 | Year-3 | Year-4 | Year-5 | Year-6 | Year-7 | Year-8 | Year-9 |
|---|---|---|---|---|---|---|---|---|---|---|
| 1980's | 29 | |||||||||
| 1990's | 23 | 23 | 25 | 26 | 27 | 28 | 28 | 28 | 28 | 28 |
| 2000's | 28 | 27 | 24 | 23 | 22 | 22 | 22 | 22 | 22 | 22 |
| 2010's | 22 | 22 | 22 | 22 | 22 | 21 | 21 | 21 | 21 | 23 |
| 2020's | 23 | 23 | 23 | 23 | 23 |
| - = No Data Reported; -- = Not Applicable; NA = Not Available; W = Withheld to avoid disclosure of individual company data. |
| Release Date: 6/30/2026 |
| Next Release Date: 7/31/2026 |