|
Download Data (XLS File) |
|
|||||
|
|||||
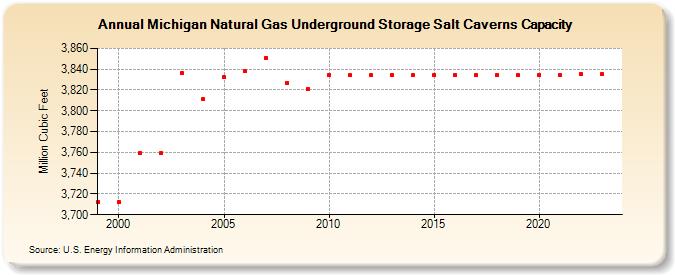
| Michigan Natural Gas Underground Storage Salt Caverns Capacity (Million Cubic Feet) | |||||
| Decade | Year-0 | Year-1 | Year-2 | Year-3 | Year-4 | Year-5 | Year-6 | Year-7 | Year-8 | Year-9 |
|---|---|---|---|---|---|---|---|---|---|---|
| 1990's | 3,712 | |||||||||
| 2000's | 3,712 | 3,759 | 3,759 | 3,836 | 3,811 | 3,832 | 3,838 | 3,851 | 3,827 | 3,821 |
| 2010's | 3,834 | 3,834 | 3,834 | 3,834 | 3,834 | 3,834 | 3,834 | 3,834 | 3,834 | 3,834 |
| 2020's | 3,834 | 3,834 | 3,835 | 3,835 | 3,835 |
| - = No Data Reported; -- = Not Applicable; NA = Not Available; W = Withheld to avoid disclosure of individual company data. |
| Release Date: 6/30/2026 |
| Next Release Date: 7/31/2026 |