|
Download Data (XLS File) |
|
|||||
|
|||||
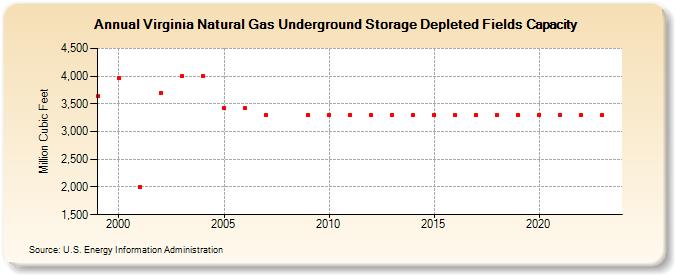
| Virginia Natural Gas Underground Storage Depleted Fields Capacity (Million Cubic Feet) | |||||
| Decade | Year-0 | Year-1 | Year-2 | Year-3 | Year-4 | Year-5 | Year-6 | Year-7 | Year-8 | Year-9 |
|---|---|---|---|---|---|---|---|---|---|---|
| 1990's | 3,638 | |||||||||
| 2000's | 3,967 | 2,000 | 3,700 | 4,000 | 4,000 | 3,417 | 3,417 | 3,300 | 3,300 | |
| 2010's | 3,300 | 3,300 | 3,300 | 3,300 | 3,300 | 3,300 | 3,300 | 3,300 | 3,300 | 3,300 |
| 2020's | 3,300 | 3,300 | 3,300 | 3,300 | 3,300 |
| - = No Data Reported; -- = Not Applicable; NA = Not Available; W = Withheld to avoid disclosure of individual company data. |
| Release Date: 5/29/2026 |
| Next Release Date: 6/30/2026 |