|
Download Data (XLS File) |
|
|||||
|
|||||
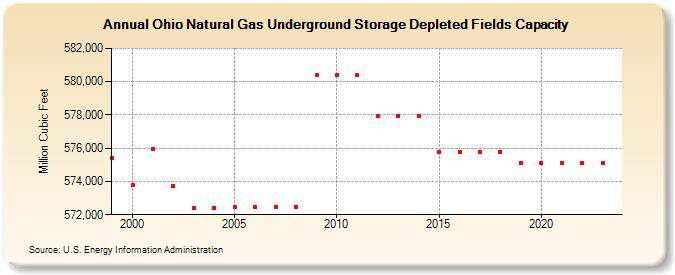
| Ohio Natural Gas Underground Storage Depleted Fields Capacity (Million Cubic Feet) | |||||
| Decade | Year-0 | Year-1 | Year-2 | Year-3 | Year-4 | Year-5 | Year-6 | Year-7 | Year-8 | Year-9 |
|---|---|---|---|---|---|---|---|---|---|---|
| 1990's | 575,384 | |||||||||
| 2000's | 573,784 | 575,959 | 573,709 | 572,404 | 572,404 | 572,477 | 572,477 | 572,477 | 572,477 | 580,380 |
| 2010's | 580,380 | 580,380 | 577,944 | 577,944 | 577,944 | 575,794 | 575,794 | 575,794 | 575,794 | 575,109 |
| 2020's | 575,109 | 575,109 | 575,109 | 575,109 | 575,109 |
| - = No Data Reported; -- = Not Applicable; NA = Not Available; W = Withheld to avoid disclosure of individual company data. |
| Release Date: 6/30/2026 |
| Next Release Date: 7/31/2026 |