|
Download Data (XLS File) |
|
|||||
|
|||||
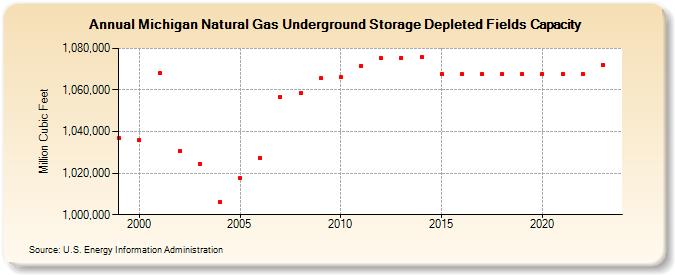
| Michigan Natural Gas Underground Storage Depleted Fields Capacity (Million Cubic Feet) | |||||
| Decade | Year-0 | Year-1 | Year-2 | Year-3 | Year-4 | Year-5 | Year-6 | Year-7 | Year-8 | Year-9 |
|---|---|---|---|---|---|---|---|---|---|---|
| 1990's | 1,036,886 | |||||||||
| 2000's | 1,035,904 | 1,067,988 | 1,030,669 | 1,024,508 | 1,006,224 | 1,017,791 | 1,027,452 | 1,056,707 | 1,058,512 | 1,065,583 |
| 2010's | 1,066,064 | 1,071,638 | 1,075,145 | 1,075,590 | 1,075,629 | 1,067,797 | 1,067,797 | 1,067,774 | 1,067,774 | 1,067,774 |
| 2020's | 1,067,774 | 1,067,774 | 1,067,745 | 1,072,230 | 1,072,230 |
| - = No Data Reported; -- = Not Applicable; NA = Not Available; W = Withheld to avoid disclosure of individual company data. |
| Release Date: 6/30/2026 |
| Next Release Date: 7/31/2026 |