|
Download Data (XLS File) |
|
|||||
|
|||||
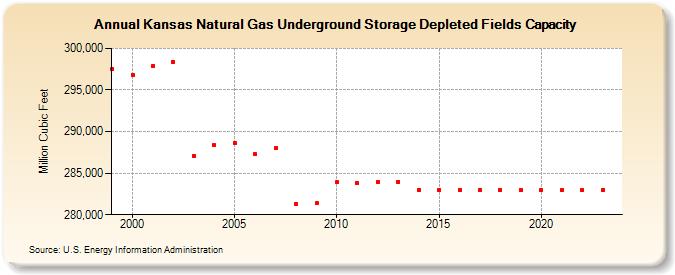
| Kansas Natural Gas Underground Storage Depleted Fields Capacity (Million Cubic Feet) | |||||
| Decade | Year-0 | Year-1 | Year-2 | Year-3 | Year-4 | Year-5 | Year-6 | Year-7 | Year-8 | Year-9 |
|---|---|---|---|---|---|---|---|---|---|---|
| 1990's | 297,501 | |||||||||
| 2000's | 296,801 | 297,901 | 298,381 | 287,105 | 288,357 | 288,655 | 287,295 | 287,996 | 281,291 | 281,370 |
| 2010's | 283,891 | 283,800 | 283,974 | 283,974 | 282,984 | 282,984 | 282,986 | 282,986 | 282,986 | 282,986 |
| 2020's | 282,986 | 282,986 | 282,986 | 282,986 | 282,986 |
| - = No Data Reported; -- = Not Applicable; NA = Not Available; W = Withheld to avoid disclosure of individual company data. |
| Release Date: 5/29/2026 |
| Next Release Date: 6/30/2026 |