|
Download Data (XLS File) |
|
|||||
|
|||||
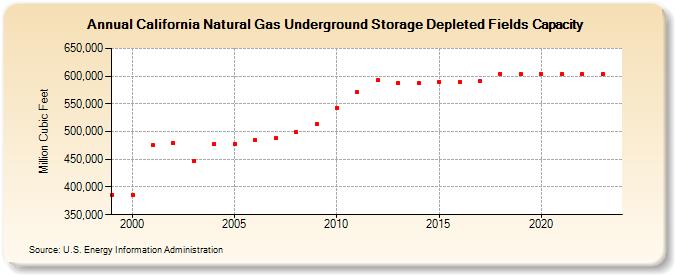
| California Natural Gas Underground Storage Depleted Fields Capacity (Million Cubic Feet) | |||||
| Decade | Year-0 | Year-1 | Year-2 | Year-3 | Year-4 | Year-5 | Year-6 | Year-7 | Year-8 | Year-9 |
|---|---|---|---|---|---|---|---|---|---|---|
| 1990's | 386,230 | |||||||||
| 2000's | 386,230 | 474,919 | 478,995 | 446,095 | 478,226 | 477,726 | 484,711 | 487,711 | 498,705 | 513,005 |
| 2010's | 542,511 | 570,511 | 592,411 | 587,711 | 587,711 | 589,808 | 589,308 | 591,108 | 603,808 | 604,048 |
| 2020's | 604,048 | 604,048 | 604,048 | 604,048 | 604,048 |
| - = No Data Reported; -- = Not Applicable; NA = Not Available; W = Withheld to avoid disclosure of individual company data. |
| Release Date: 6/30/2026 |
| Next Release Date: 7/31/2026 |