|
Download Data (XLS File) |
|
|||||
|
|||||
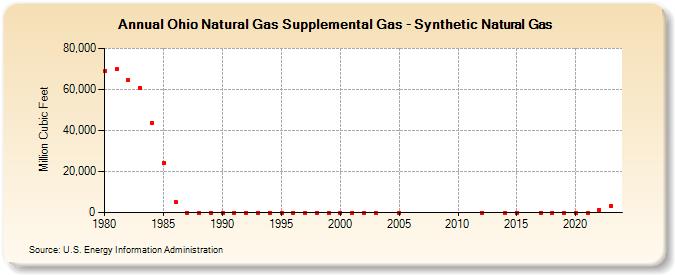
| Ohio Natural Gas Supplemental Gas - Synthetic Natural Gas (Million Cubic Feet) | |||||
| Decade | Year-0 | Year-1 | Year-2 | Year-3 | Year-4 | Year-5 | Year-6 | Year-7 | Year-8 | Year-9 |
|---|---|---|---|---|---|---|---|---|---|---|
| 1980's | 69,156 | 69,756 | 64,430 | 60,785 | 43,847 | 24,334 | 5,168 | 0 | 0 | 0 |
| 1990's | 0 | 0 | 0 | 0 | 0 | 0 | 0 | 0 | 0 | 0 |
| 2000's | 0 | 0 | 0 | 0 | 0 | |||||
| 2010's | 0 | 0 | 0 | 0 | 0 | 0 | ||||
| 2020's | 0 | 0 | 1,280 | 3,966 | 4,995 |
| - = No Data Reported; -- = Not Applicable; NA = Not Available; W = Withheld to avoid disclosure of individual company data. |
| Release Date: 6/30/2026 |
| Next Release Date: 7/31/2026 |