|
Download Data (XLS File) |
|
|||||
|
|||||
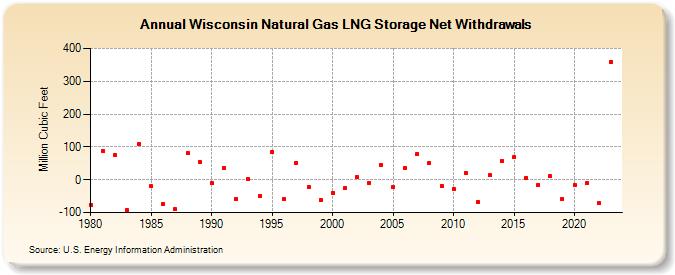
| Wisconsin Natural Gas LNG Storage Net Withdrawals (Million Cubic Feet) | |||||
| Decade | Year-0 | Year-1 | Year-2 | Year-3 | Year-4 | Year-5 | Year-6 | Year-7 | Year-8 | Year-9 |
|---|---|---|---|---|---|---|---|---|---|---|
| 1980's | -76 | 87 | 76 | -93 | 110 | -20 | -74 | -90 | 81 | 54 |
| 1990's | -10 | 35 | -59 | 2 | -50 | 85 | -60 | 51 | -21 | -61 |
| 2000's | -40 | -26 | 8 | -9 | 45 | -23 | 36 | 78 | 51 | -18 |
| 2010's | -29 | 20 | -67 | 13 | 58 | 68 | 6 | -16 | 10 | -58 |
| 2020's | -16 | -11 | -72 | 358 | 1,000 |
| - = No Data Reported; -- = Not Applicable; NA = Not Available; W = Withheld to avoid disclosure of individual company data. |
| Release Date: 6/30/2026 |
| Next Release Date: 7/31/2026 |