|
Download Data (XLS File) |
|
|||||
|
|||||
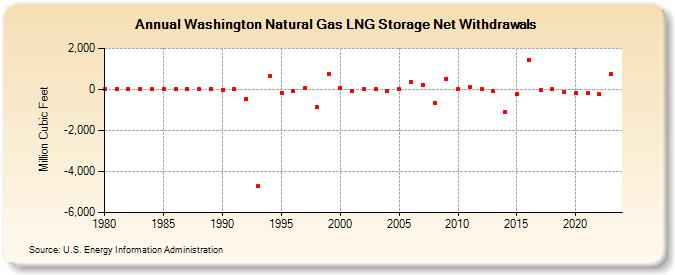
| Washington Natural Gas LNG Storage Net Withdrawals (Million Cubic Feet) | |||||
| Decade | Year-0 | Year-1 | Year-2 | Year-3 | Year-4 | Year-5 | Year-6 | Year-7 | Year-8 | Year-9 |
|---|---|---|---|---|---|---|---|---|---|---|
| 1980's | 0 | 0 | 0 | 0 | 0 | 0 | 0 | 0 | 0 | 0 |
| 1990's | -8 | 2 | -471 | -4,718 | 640 | -153 | -72 | 48 | -877 | 761 |
| 2000's | 90 | -87 | 18 | 4 | -63 | 10 | 380 | 195 | -657 | 532 |
| 2010's | 0 | 100 | 16 | -77 | -1,094 | -201 | 1,441 | -42 | 6 | -113 |
| 2020's | -184 | -185 | -244 | 733 | 401 |
| - = No Data Reported; -- = Not Applicable; NA = Not Available; W = Withheld to avoid disclosure of individual company data. |
| Release Date: 6/30/2026 |
| Next Release Date: 7/31/2026 |