|
Download Data (XLS File) |
|
|||||
|
|||||
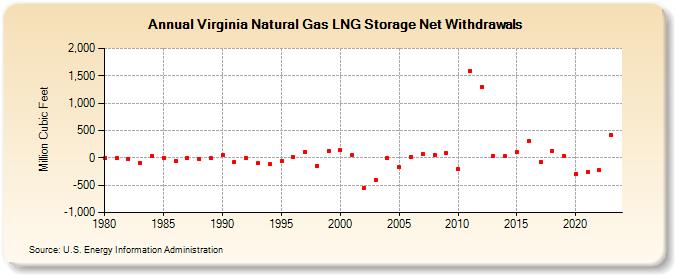
| Virginia Natural Gas LNG Storage Net Withdrawals (Million Cubic Feet) | |||||
| Decade | Year-0 | Year-1 | Year-2 | Year-3 | Year-4 | Year-5 | Year-6 | Year-7 | Year-8 | Year-9 |
|---|---|---|---|---|---|---|---|---|---|---|
| 1980's | -7 | -5 | -14 | -87 | 41 | -3 | -49 | 4 | -29 | -6 |
| 1990's | 48 | -71 | 6 | -102 | -121 | -62 | 17 | 108 | -142 | 126 |
| 2000's | 146 | 56 | -543 | -400 | 0 | -168 | 24 | 79 | 58 | 81 |
| 2010's | -207 | 1,588 | 1,296 | 40 | 28 | 101 | 299 | -76 | 122 | 40 |
| 2020's | -297 | -259 | -226 | 424 | 28 |
| - = No Data Reported; -- = Not Applicable; NA = Not Available; W = Withheld to avoid disclosure of individual company data. |
| Release Date: 6/30/2026 |
| Next Release Date: 7/31/2026 |