|
Download Data (XLS File) |
|
|||||
|
|||||
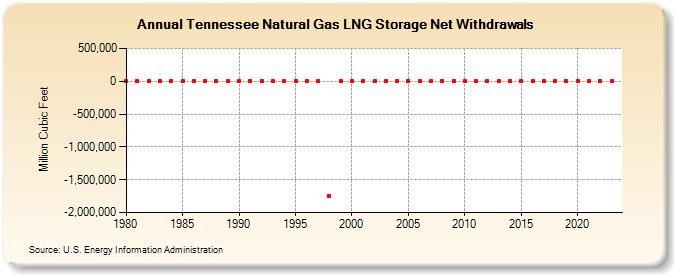
| Tennessee Natural Gas LNG Storage Net Withdrawals (Million Cubic Feet) | |||||
| Decade | Year-0 | Year-1 | Year-2 | Year-3 | Year-4 | Year-5 | Year-6 | Year-7 | Year-8 | Year-9 |
|---|---|---|---|---|---|---|---|---|---|---|
| 1980's | -1,643 | -234 | 641 | -1,245 | 1,073 | -372 | 71 | -93 | 56 | -1,879 |
| 1990's | 631 | -401 | -306 | -268 | 106 | -621 | -1,175 | -541 | -1,746,367 | -824 |
| 2000's | -1,780 | -667 | -385 | 1,071 | 651 | 421 | -269 | -1,552 | -1,324 | -882 |
| 2010's | -1,563 | 189 | 65 | -1,262 | -532 | 648 | 955 | 767 | 1,207 | 943 |
| 2020's | -51 | 209 | 913 | 948 | -79 |
| - = No Data Reported; -- = Not Applicable; NA = Not Available; W = Withheld to avoid disclosure of individual company data. |
| Release Date: 6/30/2026 |
| Next Release Date: 7/31/2026 |