|
Download Data (XLS File) |
|
|||||
|
|||||
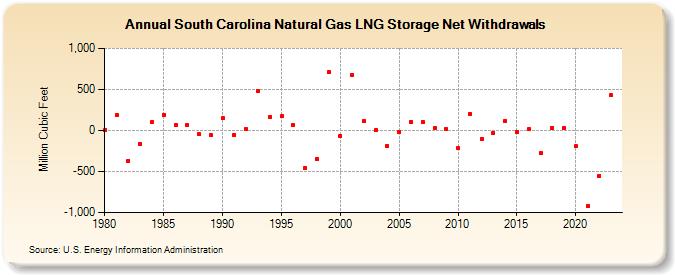
| South Carolina Natural Gas LNG Storage Net Withdrawals (Million Cubic Feet) | |||||
| Decade | Year-0 | Year-1 | Year-2 | Year-3 | Year-4 | Year-5 | Year-6 | Year-7 | Year-8 | Year-9 |
|---|---|---|---|---|---|---|---|---|---|---|
| 1980's | 3 | 190 | -366 | -160 | 104 | 191 | 61 | 64 | -44 | -57 |
| 1990's | 147 | -50 | 16 | 478 | 165 | 173 | 65 | -455 | -350 | 711 |
| 2000's | -63 | 680 | 117 | 2 | -191 | -19 | 108 | 102 | 26 | 15 |
| 2010's | -214 | 204 | -100 | -35 | 119 | -14 | 17 | -275 | 34 | 29 |
| 2020's | -193 | -922 | -551 | 427 | 49 |
| - = No Data Reported; -- = Not Applicable; NA = Not Available; W = Withheld to avoid disclosure of individual company data. |
| Release Date: 6/30/2026 |
| Next Release Date: 7/31/2026 |