|
Download Data (XLS File) |
|
|||||
|
|||||
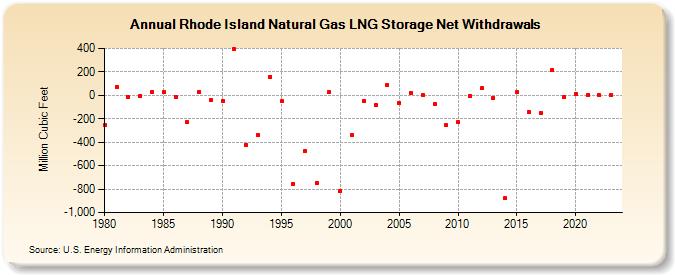
| Rhode Island Natural Gas LNG Storage Net Withdrawals (Million Cubic Feet) | |||||
| Decade | Year-0 | Year-1 | Year-2 | Year-3 | Year-4 | Year-5 | Year-6 | Year-7 | Year-8 | Year-9 |
|---|---|---|---|---|---|---|---|---|---|---|
| 1980's | -255 | 73 | -17 | -8 | 31 | 27 | -16 | -230 | 31 | -38 |
| 1990's | -46 | 393 | -420 | -337 | 160 | -51 | -753 | -476 | -749 | 24 |
| 2000's | -812 | -341 | -47 | -84 | 87 | -64 | 21 | 4 | -74 | -256 |
| 2010's | -230 | -7 | 60 | -21 | -879 | 25 | -142 | -149 | 217 | -14 |
| 2020's | 15 | 2 | 0 | 2 | 1 |
| - = No Data Reported; -- = Not Applicable; NA = Not Available; W = Withheld to avoid disclosure of individual company data. |
| Release Date: 6/30/2026 |
| Next Release Date: 7/31/2026 |